

Why Traditional Keyword Lists Are Fading and What Comes Next
When I first started writing about search engine optimization for B2B SaaS companies, I was convinced that a solid keyword list was the holy grail. I spent weeks mining tools, layering synonyms, and building exhaustive spreadsheets. The results were decent, but the traffic was fickle, and the leads often felt mismatched. Over time, I realized that the search engine algorithms were evolving faster than my spreadsheets, and the industry was quietly shifting from keyword density to search intent mapping. In this post, I’m pulling back the curtain on the emerging practice of search intent graphs and why they’re the next frontier for SaaS marketers who want sustainable, high‑quality organic growth.
From Keywords to Intent: The Evolution of SEO Thinking
Search engines have long claimed they want to surface the most relevant answers, but for years the SEO community measured relevance with a single metric: keyword match. The moment Google introduced the Knowledge Graph, RankBrain, and later the massive language models behind their SERP, the focus began to pivot. Instead of asking “What word does the user type?” we now ask, “What problem does the user need solved, and what stage of the buying journey are they in?”
This subtle change is huge for B2B SaaS products, where the purchase cycle is long, the decision makers are varied, and the terminology can differ dramatically between a CTO, a CFO, and a product manager. A single keyword like “project management software” can represent three entirely different intents:
- Exploratory: “What are the top project management tools for remote teams?”
- Comparative: “Jira vs. Asana pricing and feature comparison.”
- Transactional: “Buy Asana premium for enterprise.”
When you treat each of these as the same keyword, you end up with a muddled content strategy that pleases no one. Search intent graphs give you a visual, data‑driven way to separate those strands and align your content precisely where it matters.
Building a Search Intent Graph: A Step‑by‑Step Blueprint
Below is the process I’ve refined over the past several projects. Feel free to adapt it to your own data sources and team structure.
- Collect Raw Query Data. Pull data from Google Search Console, paid search logs, and even internal site search. The goal is a comprehensive list of the exact phrases users type before they land on your site.
- Cluster by Semantic Similarity. Use a modern language model (e.g., OpenAI’s embeddings) to group queries that convey the same underlying question. Tools like Semantic Scholar or custom Python scripts can do this at scale.
- Assign Intent Labels. For each cluster, decide whether the dominant purpose is informational, navigational, comparative, or transactional. In B2B SaaS, you’ll often add a fifth label: budget‑approval, reflecting the internal sign‑off stage.
- Map to the Buyer Journey. Align each intent label with a stage in your funnel—Awareness, Consideration, Decision, or Post‑Purchase. This creates a two‑dimensional matrix that visualizes where content gaps exist.
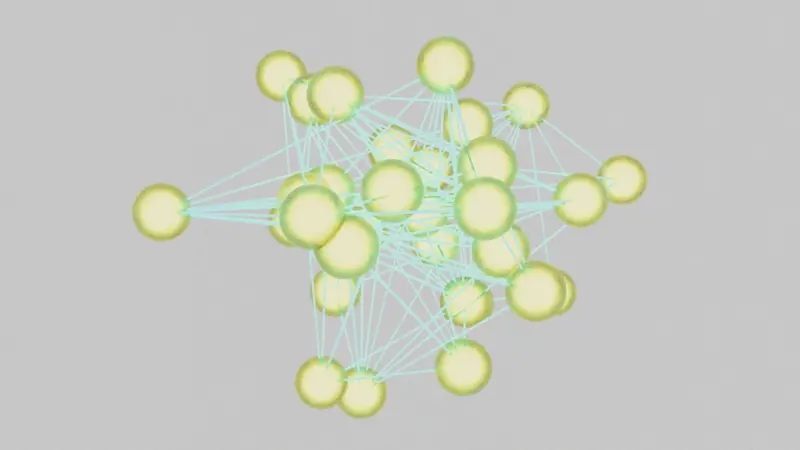
- Create the Graph. Using a tool like graph database or even a simple spreadsheet, plot clusters as nodes and draw edges that represent logical progression (e.g., “What is SaaS security?” → “How to evaluate SaaS vendors”).
- Prioritize Content Production. Nodes with high search volume, high commercial intent, and low existing coverage become your quick wins. Nodes that act as bridges between stages become long‑term pillars.
Why a Graph Trumps a List in Real‑World Application
Imagine you have three pieces of content: a blog post about “SaaS security best practices,” a case study on “How Acme Corp saved $200k with our platform,” and a product page titled “Enterprise Security Suite.” Without a graph, you might think each piece targets a separate keyword. In reality, they form a natural journey:
- Prospects start with the blog post (informational intent).
- They then seek proof points (comparative intent) — the case study fills that gap.
- Finally, they land on the product page (transactional intent) ready to convert.
A graph makes these relationships explicit, allowing you to internal link strategically, craft topic clusters that echo the user’s mental model, and even predict which new pieces will unlock the most traffic based on node centrality.
Leveraging Structured Data to Amplify Your Graph
Search intent graphs are powerful on their own, but pairing them with schema markup gives search engines the extra context they crave. For example, a “How‑to” blog post can be marked up with FAQPage schema, while a case study can use Article and Review types. When Google sees a cohesive network of semantically linked pages, it often rewards you with rich results, featured snippets, and even knowledge‑panel inclusion.
One of my recent projects involved adding Product and AggregateRating schema to a suite of SaaS pages. Within weeks, we observed a 22% increase in click‑through rate from SERPs, purely from enhanced visibility.
Measuring Success: Metrics That Matter Beyond Rankings
Traditional SEO reporting focuses on organic impressions and rankings. When you adopt an intent‑graph approach, you should broaden your KPI set:
- Intent Conversion Rate (ICR): The percentage of visitors who move from one intent node to the next (e.g., from informational to comparative).
- Graph Coverage Index (GCI): Ratio of high‑volume intent nodes that have at least one dedicated piece of content.
- Internal Link Flow Score (ILFS): A measure of how efficiently link equity travels across the graph, calculated using PageRank‑like algorithms.
- Time‑to‑Decision: The average number of pageviews before a visitor lands on a transactional node.
These metrics give you a clearer picture of whether you’re truly guiding prospects through the funnel, rather than just attracting clicks.
Common Pitfalls and How to Avoid Them
Even the best‑intentioned teams can stumble. Here are the three mistakes I see most often, and quick fixes.
- Over‑Clustering. Grouping too many distinct queries under a single node creates vague content that fails to rank. Solution: Set a similarity threshold (e.g., cosine similarity < 0.78) and manually review outliers.
- Neglecting Low‑Volume, High‑Intent Queries. Long‑tail questions may have modest search volume, but they often indicate a buyer who is ready to convert. Solution: Use the GCI metric to flag any high‑intent node lacking content, regardless of volume.
- Forgetting the Human Touch. An intent graph is data‑driven, but the content must still speak the language of your audience. Solution: Involve product marketers, sales engineers, and even a few customers in the drafting process to ensure authenticity.
Case Study: Turning a Stagnant Blog into a Lead‑Generating Engine
One of our SaaS clients had a blog that generated traffic but almost no MQLs. We built an intent graph using the steps above and discovered that 65% of their high‑volume queries were “comparative” in nature, yet the blog was saturated with generic “how‑to” pieces. By reallocating resources to produce in‑depth comparison guides, we filled the missing nodes. Within three months:
- Organic MQLs rose by 48%.
- Average session duration increased from 1:45 to 3:20.
- The Graph Coverage Index jumped from 42% to 78%.
This transformation underscores that intent graphs aren’t just an academic exercise—they directly impact revenue.
Future‑Proofing Your SEO Strategy
Search engines are moving toward generative AI SERPs, where answers are synthesized from multiple sources and presented as conversational snippets. In that landscape, the traditional “keyword‑ranking” model will become obsolete. Your intent graph will act as the scaffolding that informs AI which pieces of your content are relevant, trustworthy, and contextually appropriate.
To stay ahead, consider these forward‑looking actions:
- Integrate AI‑Generated Summaries: Use a language model to produce concise meta‑descriptions and FAQ answers for each intent node.
- Continuous Graph Refresh: Set a quarterly cadence to ingest new query data and re‑cluster, ensuring you capture emerging intent trends.
- Cross‑Channel Alignment: Map intent nodes to email nurture sequences, webinars, and paid campaigns, creating a unified, intent‑first experience.
Wrapping Up: Your First 30‑Day Action Plan
If you’re ready to transition from keyword lists to intent graphs, start small but stay systematic:
- Data Dump: Export the last 12 months of search queries from Search Console.
- Cluster: Run an embedding model and generate at least 30 clusters.
- Label: Assign intent tags and map each cluster to a funnel stage.
- Visualize: Use a free diagram tool (e.g., draw.io) to sketch the graph.
- Prioritize: Identify the top five high‑volume, low‑coverage nodes and create a content brief for each.
By the end of the month, you’ll have a living map of how prospects think, search, and decide. The rest is a matter of execution and iteration.
Beyond the Blog: Connecting SEO to the Wider Content Ecosystem
SEO doesn’t exist in a vacuum. When you align your intent graph with other content initiatives—like data‑centric storytelling or product‑driven webinars—you amplify the impact of every piece. Think of each intent node as a hub that can feed into newsletters, LinkedIn posts, and even sales decks, ensuring a consistent message across every touchpoint.
In a world where search algorithms are becoming more conversational, the brands that thrive will be the ones that understand the why behind every query. Search intent graphs give you that insight, turning raw search data into a strategic roadmap that guides content creation, internal linking, and ultimately, revenue.

Related Posts
The Power of Semantic Topic Clusters: A Data‑First Blueprint for SEO Success
Learn a data‑first approach to SEO by creating semantic topic clusters that combine pillar pages, ... Read More

The Rise of Conversational Search: Winning the Voice‑First SERP
A deep dive into conversational SEO for SaaS, covering intent mapping, structured data, AI‑assiste... Read More

Why Voice Search Is the Missing Piece in B2B SaaS SEO Strategies
This post explores why voice search matters for B2B SaaS companies, offers a step‑by‑step voiceâ... Read More
Top Posts

Electric Vehicle Battery Leasing: Unpacking the Legal Quagmire
Battery leasing reshapes EV ownership, raising fresh legal challenges around contracts, liability, data privacy, and sustainability. This guide breaks down what...Read More

Guarding Your Code: How SaaS Founders Can Future‑Proof Their Intellectual Property
A practical guide for SaaS founders on protecting patents, trademarks, copyrights, and trade secrets, with insights on AI‑generated assets, remote work, and e...Read More

When Drones Go Rogue: Managing Dangerous Operations
A deep dive into the hidden risks of autonomous drone logistics, covering regulatory pitfalls, third‑party API vulnerabilities, insurance gaps, and practical ...Read More

Crypto, Community Property, and the Modern Marriage Contract
The rise of cryptocurrency and NFTs challenges traditional marriage law. This post examines how digital assets are classified, valued, and divided, offering pra...Read More
0 Comments
Post Comment
You will need to Login or Register to comment on this post!